If you get an OutOfMemoryError with the message “Java heap space” (not to be confused with message “PermGen space”), it simply means the JVM ran out of memory. When it occurs, you basically have 2 options:
Solution 1. Allow the JVM to use more memory
With the -Xmx JVM argument, you can set the heap size. For instance, you can allow the JVM to use 4 GB (4096 MB) of memory with the following command:
$ java -Xmx4096m ...
Solution 2. Improve or fix the application to reduce memory usage
In many cases, like in the case of a memory leak, that second option is the only good solution. A memory leak happens when the application creates more and more objects and never releases them. The garbage collector cannot collect those objects and the application will eventually run out of memory. At this point, the JVM will throw an OOM (OutOfMemoryError).
A memory leak can be very latent. For instance, the application might behave flawlessly during development and QA. However, it suddenly throws a OOM after several days in production at customer site. To solve that issue, you first need to find the root cause of it. The root cause can be very hard to find in development if the problem cannot be reproduced. Follow those steps to find the root cause of the OOM:
Step 1. Generate a heap dump on OutOfMemoryError
Start the application with the VM argument -XX:+HeapDumpOnOutOfMemoryError. This will tell the JVM to produce a heap dump when a OOM occurs:
$ java -XX:+HeapDumpOnOutOfMemoryError ...
Step 2. Reproduce the problem
Well, if you cannot reproduce the problem in dev, you may have to use the production environment. When you reproduce the problem and the application throws an OOM, it will generate a heap dump file.
Step 3. Investigate the issue using the heap dump file
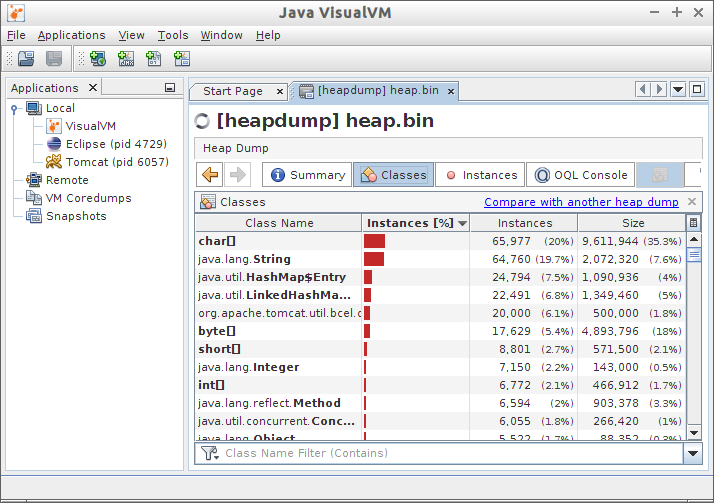
Use VisualVM to read the heap dump file and diagnose the issue. VisualVM is a program located in JDK_HOME/bin/jvisualvm. The heap dump file has all information about the memory usage of the application. It allows you to navigate the heap and see which objects use the most memory and what references prevent the garbage collector from reclaiming the memory. Here is a screenshot of VisualVM with a heap dump loaded:

This will give you very strong hints and you will (hopefully) be able to find the root cause of the problem. The problem could be a cache that grows indefinitely, a list that keeps collecting business-specific data in memory, a huge request that tries to load almost all data from database in memory, etc.
Once you know the root cause of the problem, you can elaborate solutions to fix it. In case of a cache that grows indefinitely, a good solution could be to set a reasonable limit to that cache. In case of a query that tries to load almost all data from database in memory, you may have to change the way you manipulate data; you could even have to change the behavior of some functionalities of the application.
Manually triggering heap dump
If you do not want to wait for an OOM or if you just want to see what is in memory now, you can manually generate heap dump. Here 2 options to manually trigger a heap dump.
Option 1. Use VisualVM
Open VisualVM (JDK_HOME/bin/jvisualvm), right-click on the process on the left pane and select Heap Dump. That’s it.
Option 2. Use command line tools
If you do not have a graphical environment and can’t use vnc (VisualVM needs a graphical environment), use jps and jmap to generate the heap dump file. Those programs are also located in JDK_HOME/bin/.
$ jps
6162 Jps
4729 org.eclipse.equinox.launcher_1.3.0.v20130327-1440.jar
6057 Bootstrap

$ jmap -dump:live,format=b,file=heap.bin 6057
Dumping heap to /home/user/heap.bin ...
Heap dump file created
Finally copy the heap dump file (heap.bin) to your workstation and use VisualVM to read the heap dump: File -> Load…
Alternatively, you can also use jhat to read heap dump files.
Solution 3 (bonus). Call me
You can also contact my application development company and I can personally help you with those kind of issues 🙂
Author: Jonathan Demers. See on LinkedIn.